Introduction
ROAS is the Internet Explorer of marketing KPIs. A shitty default that we have been using for far too long simply because it is a default. The reason it is so inadequate is because it does not take COGS (and other expenses like shipping) into account. As a result, the break-even ROAS of a particular product will vary wildly depending on that product’s markup.

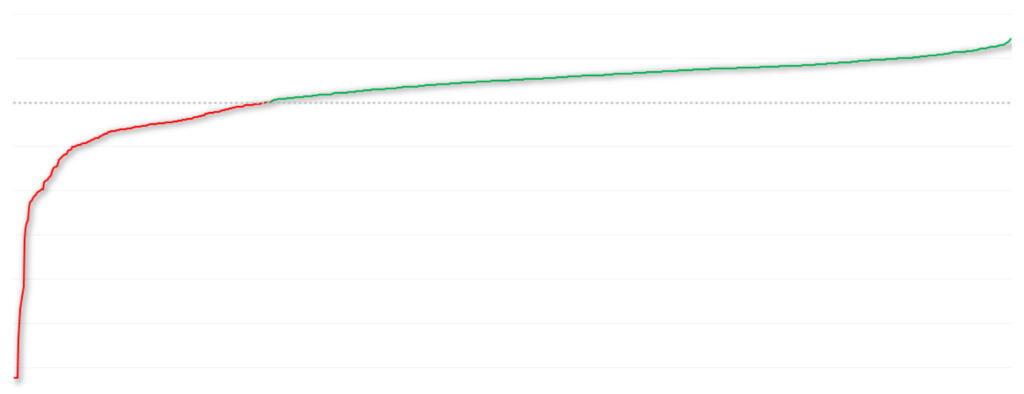
And what is true at the product level is true at the order level. In the chart below, I have plotted the break-even ROAS of over 900 (real-life) orders against the client’s target ROAS. As you can see, there is only one point at which the break-even and target ROAS are equal. For many, if not most, e-commerce businesses, the idea of an overall “target” ROAS is therefore delusional.

Our two new marketing KPI’s
In order to address the deficiencies of ROAS, we have defined 2 new marketing KPIs at AdNudging: Marketing Profit and Profit on Ad Spend (POAS). Unlike Revenue & ROAS, Marketing Profit & POAS take into account COGS and shipping. “So what?”, you may ask. Well, something very interesting (magical even) happens when you remove the noise of cost prices from your revenue numbers: the break-even POAS for a product, regardless of that product’s markup, will ALWAYS be 1. Let me repeat that. The break-even POAS for a product will ALWAYS be 1. “So what?”, you may ask.

Well, by replacing ROAS with POAS, you now have a KPI that is a true indicator of a marketing campaign’s profitability. Any value over 1 means gross profit from the order exceeds ad spend, while any value below 1 means ad spend exceeds gross profit. What is more, the task of converting a high-level growth or profitability target into a marketing target becomes child’s play. Say you want to earn a 15% return on your marketing. Well, your POAS target is 1.15. Try doing that with ROAS.
ROAS is dead. Long live POAS.
In the video we start with a Target ROAS of 5, which is a simple average break-even ROAS, given a markup that ranges from 20% – 30%. The orders are randomly generated (first animation), and then sorted (second animation).
As can be seen there is only 1 order that hits the target ROAS. The majority of the remaining orders are either below the Target ROAS line (indicating a loss) or above it (indicating large profits but lost potential volume)
Lars Larsen
Head of Google Ads & Partner
AdNudging


